Pediatric Mental Health Care Utilization from 2016–2021
Reporting by the Centers for Disease Control (CDC) and major media outlets signals concerning trends in the mental health of American children. When surveyed, nearly a third of parents indicated that their child’s mental or emotional health had worsened since the start of the pandemic.
However, the evidence is not unified, with some studies reporting declines in the prevalence of certain mental health conditions and events. Apart from CDC reporting from the National Syndromic Surveillance Program (NSSP), research has been limited by small samples, reliance on surveys, data lags, or a limited focus on a specific mental health condition or area of utilization.
To inform public understanding of these important issues, the Clarify Health Institute, the research arm of Clarify Health, is initiating an ongoing investigation of trends in pediatric mental and behavioral health. Leveraging an observational, national sample of health insurance claims from more than 20 million children aged 1–19 years old annually, we observe several important trends in the mental health care of America’s youth from 2016–2021.
Healthcare growth made clear.
Get granular insights and actionable growth strategies with our Growth IQ Suite, enhanced with the clarity of AI.
Major Findings
Our major findings include:
- A 61% increase in mental health inpatient (IP) hospital admissions from 2016–2021
- A 20% increase in mental health emergency department (ED) visits from 2016–2021
- Significantly higher rates of mental health IP admissions and ED visits among teenagers compared to younger children
- Significantly higher rates of mental health ED visits among children covered by Medicaid compared to children with private health insurance
Our findings align with calls to action by other national stakeholders, including the joint declaration by three pediatric medical societies and the Surgeon General’s advisory around protecting youth mental health. They point to an increasing need to improve data collection and monitoring of the mental health of America’s youth and for clinicians, health systems, and insurers to prioritize addressing the growing crisis of pediatric mental health in the United States.
Overall Trends in Pediatric Mental Health Care Utilization
We assessed mental health services utilization among children with at least one primary mental health diagnosis during the calendar year across nine mental and behavioral health conditions:
- Depressive disorders
- Other mood disorders
- Anxiety and fear-related disorders
- Obsessive-compulsive and related disorders
- Trauma- and stressor-related disorders
- Disruptive, impulse-control and conduct disorders
- Feeding and eating disorders
- Suicidal ideation/attempt/intentional self-harm
- Neurodevelopmental disorders
Our estimates are case-mix adjusted to account for any sample population differences in age or sex over time.
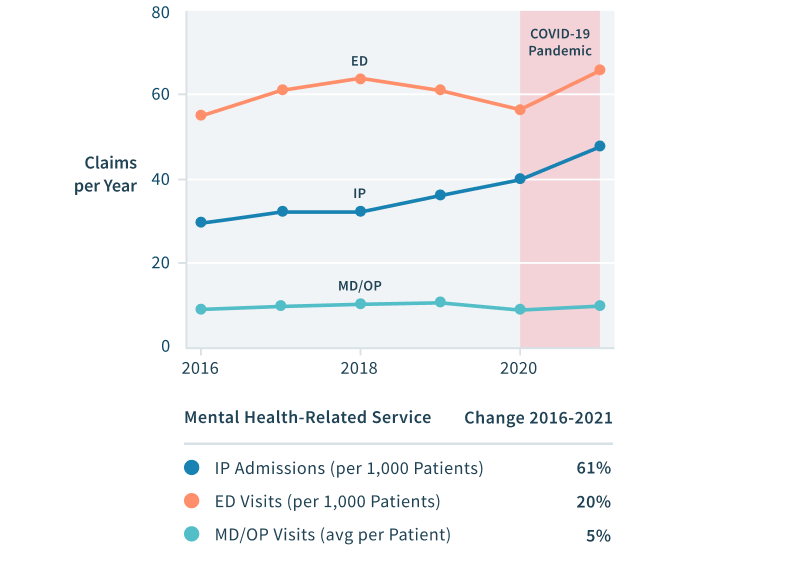
FIGURE 1: Trends in IP, ED, and Office/outpatient (MD/OP) Utilization, 2016–2021
Figure 1 presents trends in the utilization of three categories of health services in the pediatric mental health population: acute IP admissions, ED visits, and MD/OP mental health professional visits. Overall, from 2016 to 2021 we estimate that:
- IP admissions increased 61% (from 30 to 48 visits annually per 1,000 patients)
- ED visits increased 20% (from 55 to 66 visits annually per 1,000 patients)
- MD/OP mental health services utilization rose somewhat from 2016 to 2019, but then experienced a sharp decrease in 2020, likely driven by the COVID pandemic, reducing the overall growth rate for these services to 5% from 2016 to 2021.
Our estimates are case-mix adjusted to account for any sample population differences in age or sex over time.
Regional Trends in Pediatric Mental Health Care Utilization
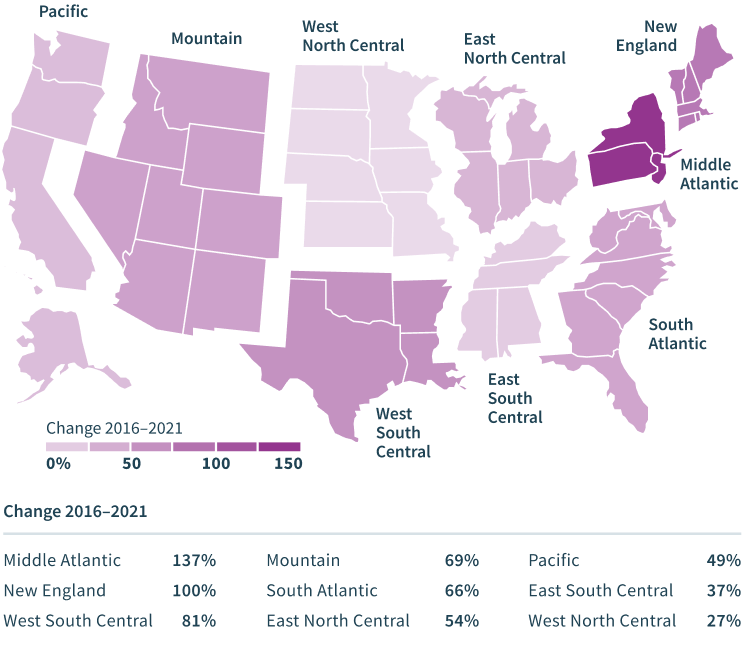
FIGURE 2: IP Utilization Growth across Regions, 2016-2021
Figure 2 highlights regional differences in pediatric mental health utilization and growth. In particular, Middle Atlantic and New England states have experienced substantially faster growth in IP admission rates among pediatric patients with a primary mental health diagnosis compared to the rest of the US, albeit from a generally lower base. Increases in mental health IP admissions ranged from a low of 27% in the West North Central region to a high of 137% in the Middle Atlantic region.
Figure 3 illustrates regional variations in IP hospital admission rates for mental health conditions, which in 2021 ranged from a low of 18 patients in the Pacific region to a high of 65 patients in the West North Central region.
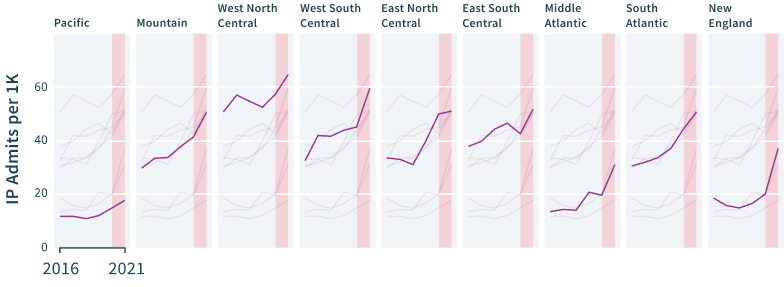
FIGURE 3: IP Utilization across Regions, 2016-2021
Age and Sex Differences in Pediatric Mental Health Care Utilization
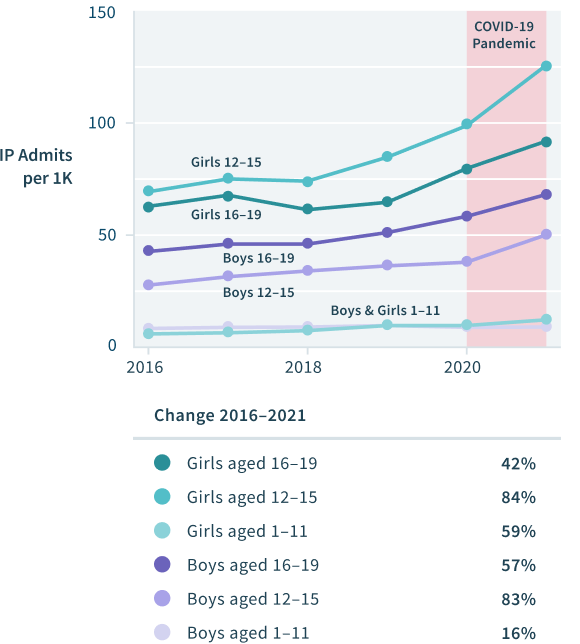
FIGURE 4: Annual Trends in IP Utilization by Age and Sex, 2016–2021
Figure 4 highlights differences in pediatric mental health inpatient utilization and growth by age and sex. Substantial increases from 2016 to 2021 are observed for both boys and girls of all age groups, but particularly among adolescents over 12 years old. Mental health IP admissions increased 84% among girls and 83% among boys aged 12–15 years old from 2016–2021. Underlying admission rates for girls aged 12–15, however, were around 2.5 times higher than admission rates for boys in the same age group across the entire time period.
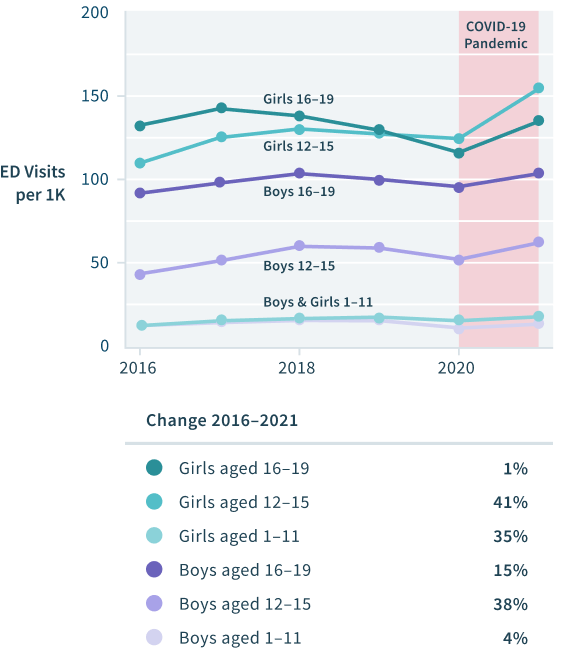
FIGURE 5: Annual Trends in ED Utilization by Age and Sex, 2016–2021
Unlock your most competitive rates yet.
Navigate any rates negotiation with ease using our Price Transparency building block, created to add complete clarity to the pricing process.
Figure 5 highlights differences in pediatric mental health ED utilization by age and sex. Girls were more likely than boys to experience an ED encounter. While ED utilization dropped at the beginning of the pandemic, rates have continued to rise more recently. ED utilization has risen significantly among 12–15 year-olds in the pediatric population with mental health conditions since 2016. Mental health ED visits increased 20% overall, ranging from a low of 1% for girls aged 16–19 years old to highs of 41% and 38% among girls and boys aged 12–15.
Utilization Differences between Medicaid- and Commercially-Insured Children
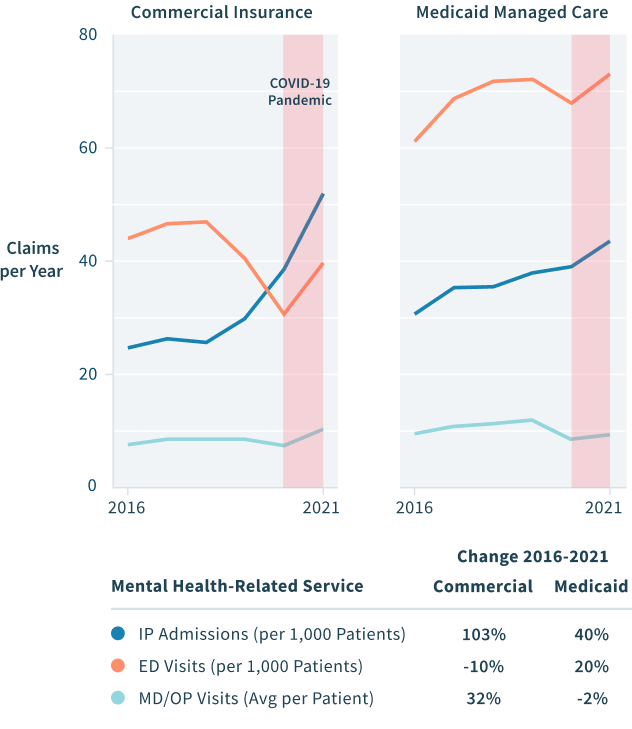
FIGURE 6: Trends in IP, ED, and OP Utilization Rates by Payer
We found significant differences in mental health utilization according to health insurance coverage, as illustrated in Figure 6. IP admissions among children with mental health conditions increased by 103% among commercially insured children and by 40% among children insured by Medicaid from 2016 to 2021. Mental health-specific ED visits declined by 10% for children with commercial insurance and increased by 20% in the Medicaid population over the same time period. Finally, since 2016 MD/OP mental health services utilization has risen 32% among children with commercial insurance and declined 2% among children with Medicaid. The decline in MD/OP utilization, coupled with the increase in ED utilization for children with Medicaid, may point to issues around adequate numbers of mental health professionals accepting Medicaid patients.
As shown in Figure 6, despite faster overall growth in the commercially insured population, overall levels of IP, ED, and MD/OP mental health services utilization have historically been higher among children with Medicaid. For the first time in 2021, IP utilization rates in the commercial population surpassed those among children with Medicaid. Mental health ED utilization among pediatric patients with mental and behavioral health conditions continues to be much higher among children with Medicaid, with utilization rates in 2021 nearly twice as high in the Medicaid population compared to children with commercial insurance.
Conclusion
We estimate that the severity of pediatric mental health conditions, especially when measured by acute mental health services utilization, has increased substantially from 2016-2021. The responsibility of addressing the trends presented in this brief fall to our health care leaders. In deciding where to focus efforts, organizations that share our concern for improving pediatric health and wellbeing may prioritize goals from the Healthy People 2030 initiative. In particular, it is imperative to increase mental and behavioral health screening rates for all children and to promote access to appropriate, evidence-based treatment for those with a diagnosis regardless of insurance coverage. These goals cannot be met by children and parents alone.
The complexity of healthcare data. Clarified.
Bridging 20 billion data points and our best-in-class benchmarking technology, the Clarify Atlas Platform® fuels every insight for ultra-precise healthcare decision-making.
AI-driven healthcare analytics that architect a simpler way to navigate complex decisions. Seamlessly grow your topline, contain costs, guide care, and more – all using the power of over 20 billion data-powered insights.
Stakeholders across the pediatric care spectrum must also prioritize additional research to assess trends and share findings. More research is specifically needed to rigorously assess interventions that aim to improve pediatric mental health and wellbeing. We must urgently ramp up these efforts in the face of the general shortage of mental health care providers and the absence of integrated mental health care in many US primary care settings. The role of behavioral health services provided by school-based programs should not be overlooked and would benefit from additional state and federal support. The recent allocation of $3.5 billion in federal funding for behavioral health programs and the introduction of an around-the-clock 988 hotline for suicide prevention and mental health crisis services represent important steps forward to improve US mental health care access.
Appendix
We note several limitations in the presented analyses, primarily arising from the use of insurance claims data. Our utilization metrics rely on patient self-reporting and mental health professionals’ diagnosis of mental health conditions within a clinical setting. Additionally, we do not observe the high volume of pediatric mental health services provided in non-clinical settings, such as through schools and community-based programs or those paid for by families out-of-pocket rather than through health insurance. Further consideration of data from these care settings is critical in establishing the full picture of adolescent mental health in the US. Mental health services are often covered separately by insurers, and increased compliance with federal and state mental health parity laws will also help to bridge gaps in access. Our review of mental health services utilization is inherently descriptive. Focused evaluations of clinically validated and culturally sensitive interventions are necessary components to address the burgeoning pediatric mental health crisis.
Data source
Presented analyses utilize a combined commercial and Medicaid managed care claims data source leveraging data from multiple payers across the US. Our sample includes an average 20 million children aged 1-19 years old annually from 2016 – 2021.
Identification/classification of mental health conditions
We identify and categorize mental and behavioral health conditions using AHRQ CCSR condition categories. Specifically, we present results among children identified with the mental and behavioral disorder (MBD) categories, defined by ICD-10 diagnosis codes, for:
- Depressive disorders (MBD002)
- Other specified and unspecified mood disorders (MBD004)
- Anxiety and fear-related disorders (MBD005)
- Obsessive-compulsive and related disorders (MBD006)
- Trauma- and stressor-related disorders (MBD007)
- Disruptive, impulse-control and conduct disorders (MBD008)
- Feeding and eating disorders (MBD010)
- Suicidal ideation/attempt/intentional self-harm (MBD012)
- Neurodevelopmental disorders (MBD014)
Utilization rates per 1,000 patients
Utilization rates by claim type (i.e., counts of IP, ED, and MD/OP) are estimated among patients enrolled in either commercial insurance or Medicaid in the current year and with at least one primary diagnosis for the mental health condition (MBD categories) during the calendar year. In comparing utilization across years, we compare the full calendar year but acknowledge that 2021 Medicaid claims may not represent all patient utilization due to a lack of 100% finalized MD/OP claims in Q4 2021.
Case-mix adjustment
With the exception of results presented separately for age and sex subgroups, all utilization results are case-mixed adjusted to account for any sample population age- or sex-differences over time. We standardize estimates to the 2019 calendar year, adjusting other annual estimates to match the age and sex distributions in this reference year.