Quality
Oct 25, 2023
Value-Based Care | October 14, 2022
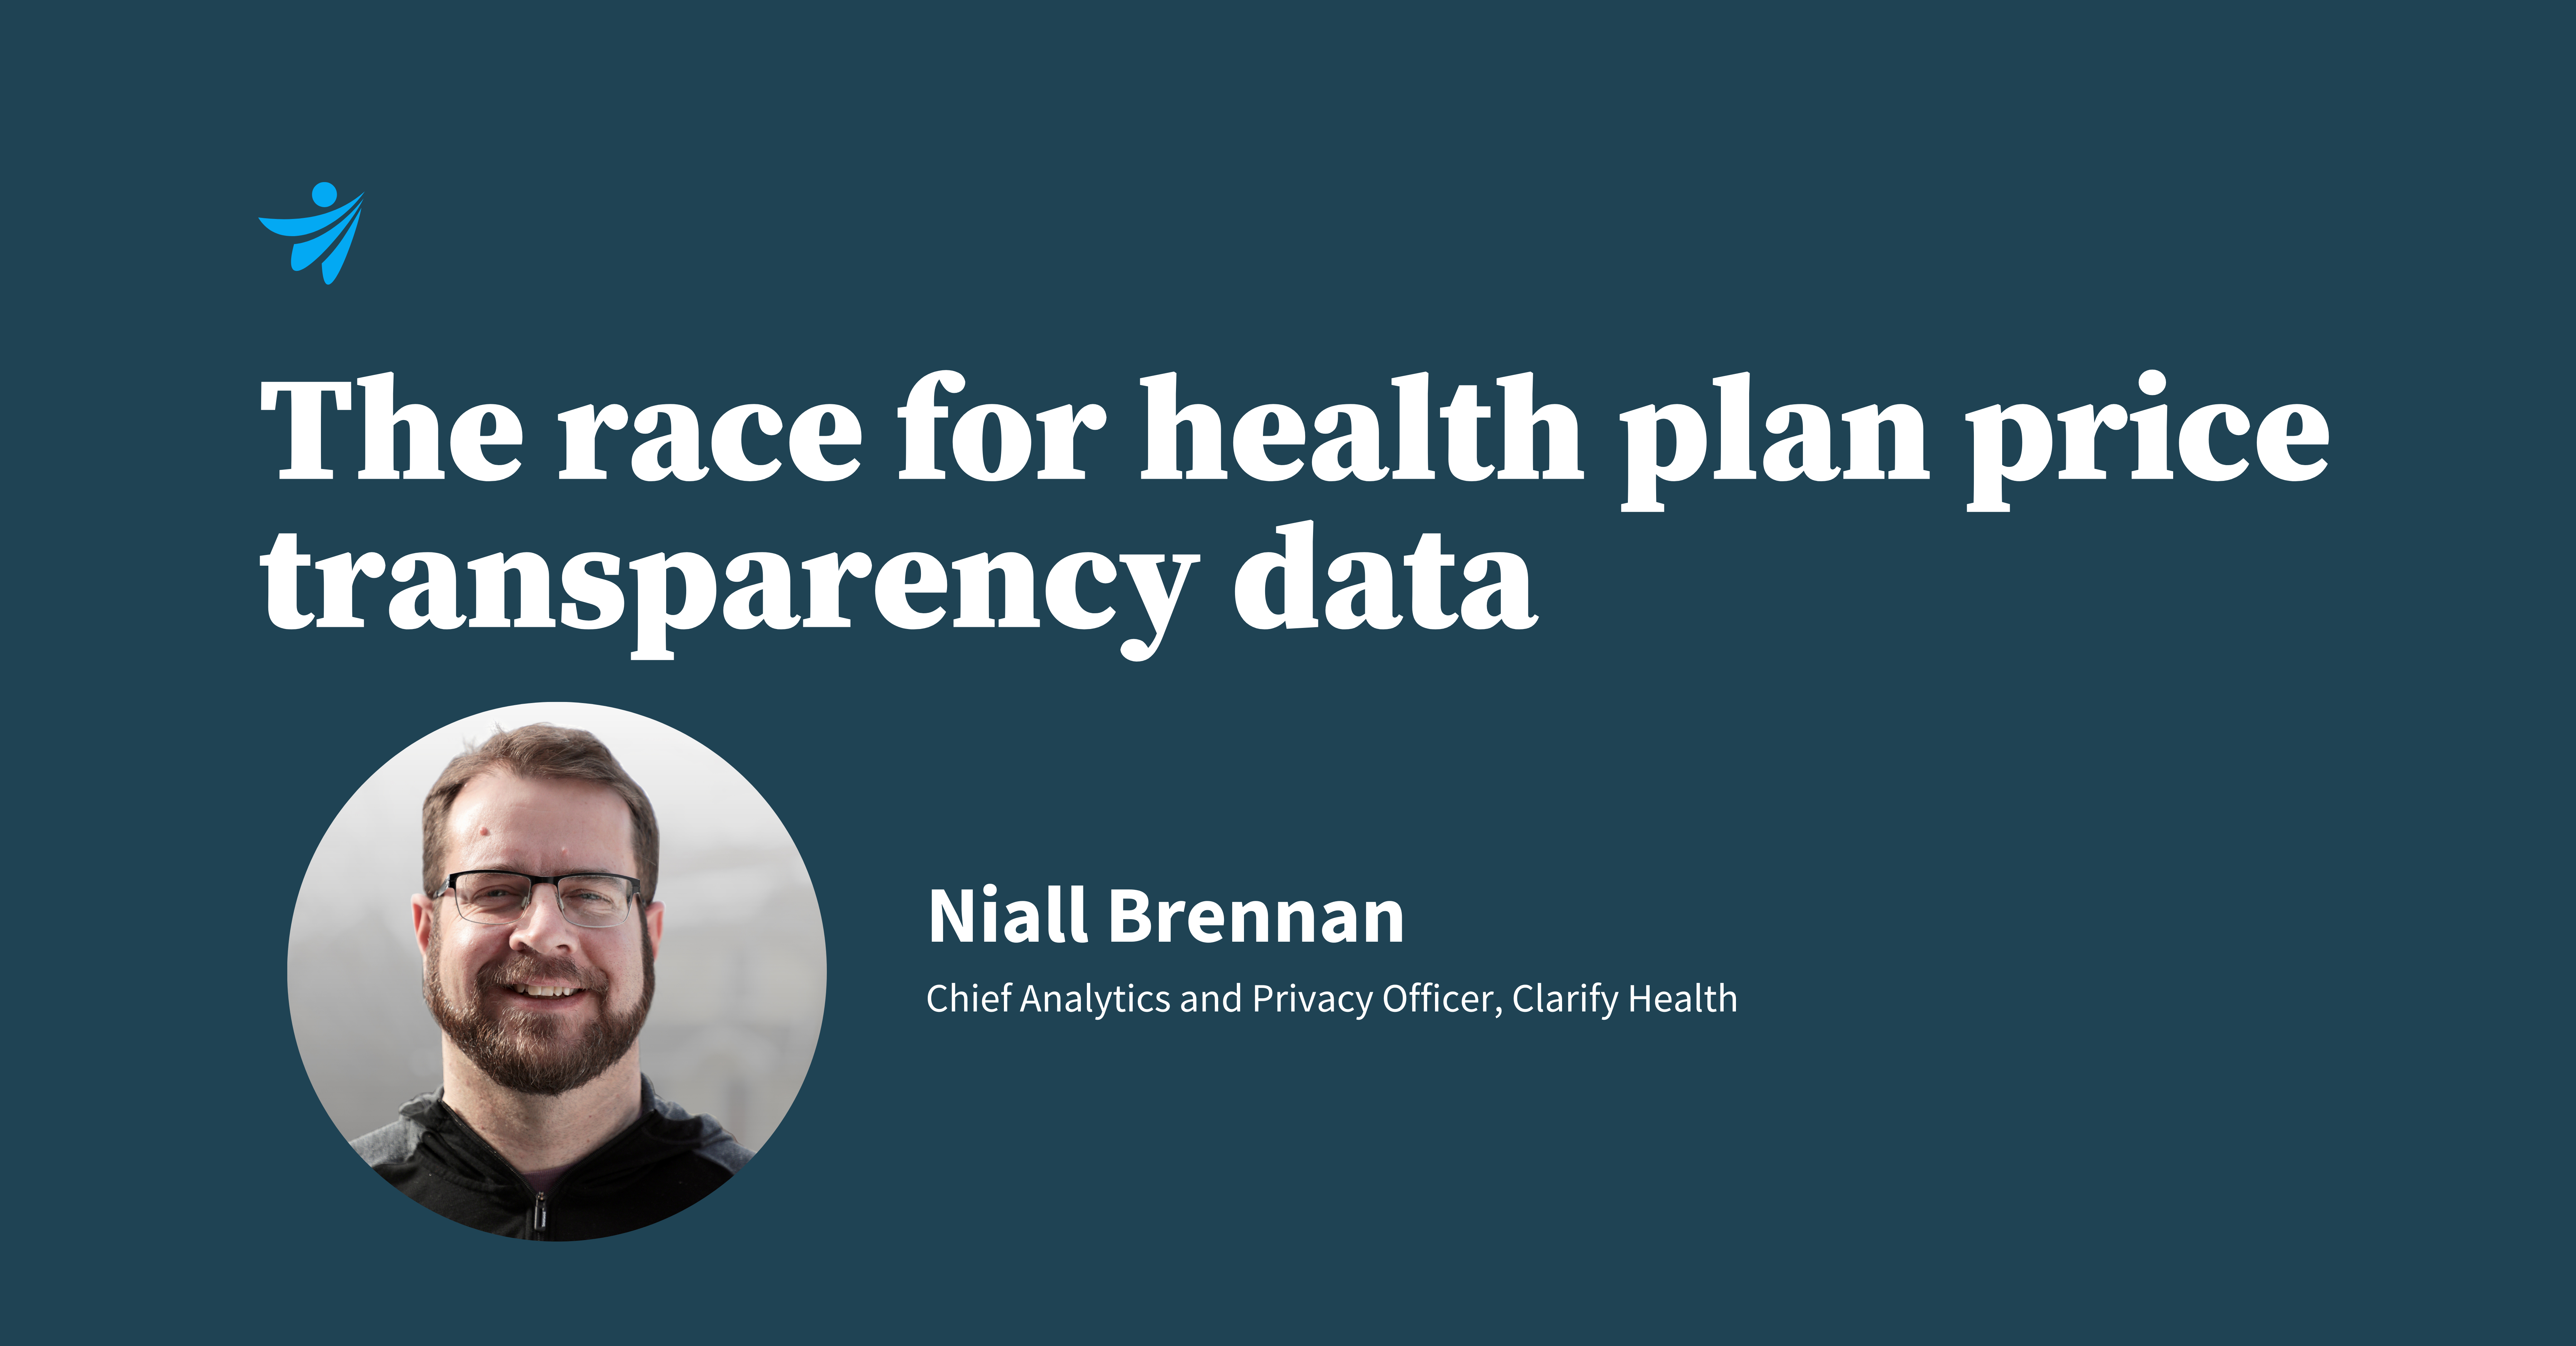
Niall Brennan is the Chief Analytics and Privacy Officer at Clarify Health. He was previously the President and CEO of the Health Care Cost Institute (HCCI) and served as the Chief Data Officer at the Centers for Medicare & Medicaid (CMS).
In this Q&A, he discusses his background in price transparency, why health plan price transparency data is so complex, and the most jaw-dropping statistics he’s seen.
What was your role in leading price transparency efforts before joining Clarify Health?
For 12 years, I was at the forefront of price transparency, guiding a lot of the efforts that led us to where we are today. As the Chief Data Officer at CMS, I led price transparency efforts for the Obama administration, including things that were considered quite revolutionary at the time—like releasing hospital-level charge master data and individual-level data on more than a million physicians on the services that they provided to Medicare beneficiaries. In addition, I created the CMS Qualified Entity Program, which gives organizations like Clarify access to 100% of Medicare fee-for-service claims data. I also engineered the CMS Virtual Research Data Center to help entrepreneurs and companies gain access to Medicare data for research purposes.
After CMS, I became CEO of the HCCI, where our goal was to understand how prices drove increases in medical spending, particularly for people with employer-sponsored coverage.
From all the analyses you’ve done on health plan price transparency data, what’s the most surprising thing you’ve seen?
The scale and complexity of the data. For example, for DRG 470 alone, UnitedHealth Group is reporting 3.8 million price/plan/provider combinations nationwide, according to a preliminary analysis of national health plan prices conducted by the Clarify Health Institute. UnitedHealth has 2,500 distinct prices for DRG 470 (which is crazy when you think about it). For many of those price/plan/provider combinations, the information is the same, but if you want a single number that characterizes the complexity of both the U.S. healthcare system and these data, 3.8 million price/plan/provider combinations is one of the numbers that comes to mind.
How does hospital price transparency data compare to the recently published health plan data?
The difference in scope and scale of the data is significant. Hospital price transparency data tends to be much smaller and is generally published in Excel spreadsheets on websites. Hospitals are only required to disclose rates for a specified number of services.
Conversely, health plan price transparency data doesn’t even fit in a spreadsheet. The files are massive, published into Machine Readable Files (MRFs), and are supposed to be refreshed monthly. A single month of UnitedHealth’s data is the equivalent of three years of every hospital physician and drug claim in the Medicare program.
What are the differences in price transparency compliance between hospitals and health plans?
CMS’s Hospital Price Transparency rule went into effect on Jan. 1, 2021, but so far, health plan compliance is higher and more universal than in hospitals. The factors driving higher compliance are:
Since the hospital price transparency rule went into effect, CMS has only levied fines against two hospitals in Georgia. At first, a lot of hospitals decided not to comply with the rule because the penalties for non-compliance were so low that it made financial sense to pay the fine and move on.
If a hospital takes a narrow approach to compliance, they can publish a few files on their website. Unfortunately, this is what a lot of hospitals tend to do. Recently, PatientRightsAdvocate.org released a study estimating that only 14% of hospitals were fully compliant with the Hospital Price Transparency rule.
What are the key considerations for someone who wants access to health plan price transparency data sets fast?
These data are so big and so overwhelming that people are drowning in it. Without a rate intelligence solution, it’s impossible to answer simple questions like ‘What’s the negotiated rate for every service between a health plan and provider in my city?’ Organizations must wade through millions of lines of data to extract what should be a simple answer. Intelligence gathered from these complex, large data sets should be able to stand on their own and be consumed easily.
Being able to dynamically interact with the data will get you the insights you need for your specific business questions much faster. When data lives in standard reports or flat files, it takes much longer to query. To access intelligence fast, you need to be able to query the data in real-time and drag-and-drop categories and metrics to create your own reports.
It’s also important to ensure the publicly available price transparency data is standardized, normalized, and enriched. All the publicly available rate data needs to be standardized into a consistent format; reimbursement methodologies need to be normalized to be able to compare rates on an apples-to-apples basis; and other data sets (i.e., claims data) need to be used to fill in missingness and remove outliers from publicly available data.
Even when all that is done, prices themselves are insufficient to answer most complex business questions. These data must be augmented with information on provider quality, the underlying risk of patient populations, and much more.
How should health plans and providers augment price transparency intelligence to answer complex business questions?
When you’re thinking about using price transparency intelligence, you don’t want to look at rates in isolation. You want to bring in claims data sets to answer more complex business questions, like: “do providers that charge more provide better, higher-value care?”
For example, health plans don’t always want to contract with a provider that has the lowest prices. If a provider has low prices and their outcomes are poor (i.e., everybody who sees that provider ends up spending more time at post-acute care facilities, more time in physical therapy, or more time at another hospital), that’s not saving anyone money, and it’s hurting patients.
What Clarify offers is a single platform to assess rates, quality, and cost-efficiency holistically. It delivers the industry’s most precise, case-mix adjusted provider performance benchmarks, drawing upon 4 billion care journeys across 300M+ unique individuals, and delivers these alongside on-demand rate intelligence solutions for hospitals and health plans. With holistic insights, you can make more informed network and contracting decisions.
Quality
Oct 25, 2023
Insights for Payers
Oct 12, 2023

Value-Based Care
Sep 12, 2023

Accelerate transformation, drive growth, and adopt innovative payment models confidently with the industry’s most trusted healthcare analytics platform, mapping over 300 million real-world patient journeys with machine-learning precision.